
Your ads are like your car, you have to spend to operate both and there are different configurations to get the most out of your spend. For your car, it might be your tires, for your ad, it could be your opening hook.
On your car, you have an instrument gauge to tell you how things are going. What’s that for your ads?
- A few key metrics to care about here in this previous post
- As well as a video guide on how to adjust your Facebook reporting dashboard to show them
- Bonus: SOP for the framework (free) I use to generate and organize key messages in ads
For bullets 1 and 2, there’s an easier way to aggregate and present this data in 1 single report, getting to your performance numbers more efficiently, reducing the need to dive into the ad accounts.
To build a dashboard for evaluating Facebook ad performance:
- Choose an ETL Tool: Pick a tool like Supermetrics or Adveronix to extract data from Facebook Ads.
- Extract Data: Configure the tool to extract relevant metrics such as cost, 3-second views, impressions, clicks, and conversions.
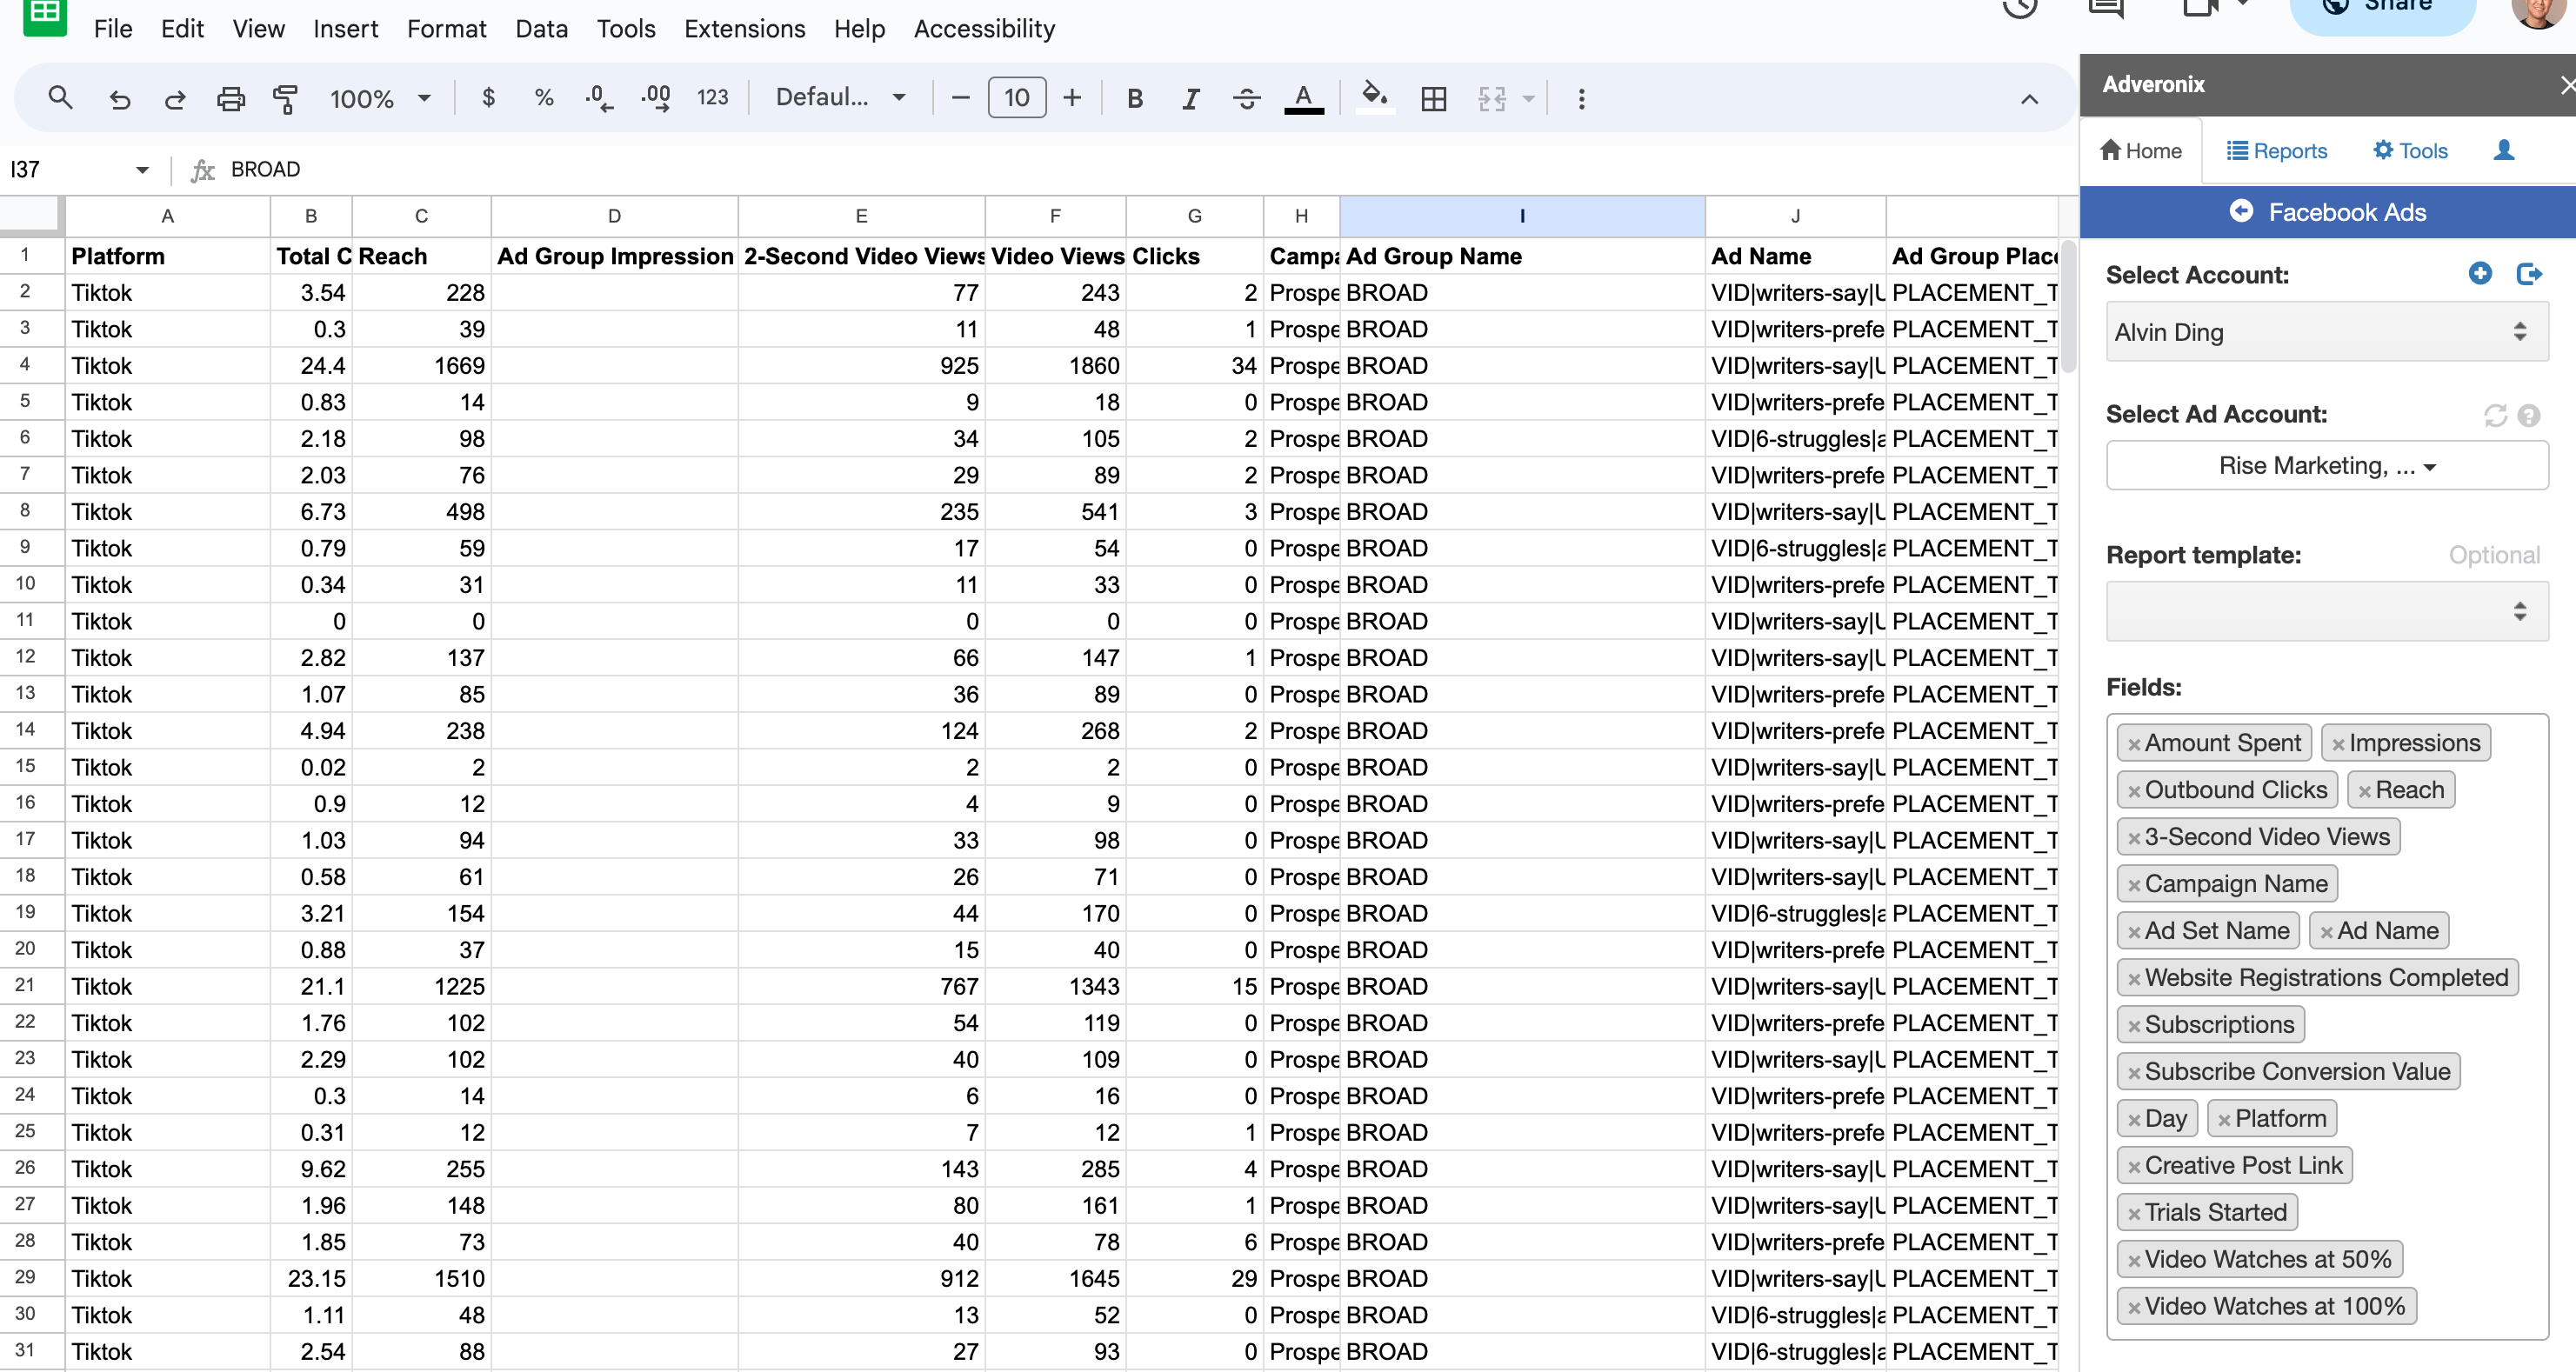
- Push to Google Sheets: Automate the data transfer from the ETL tool to Google Sheets.
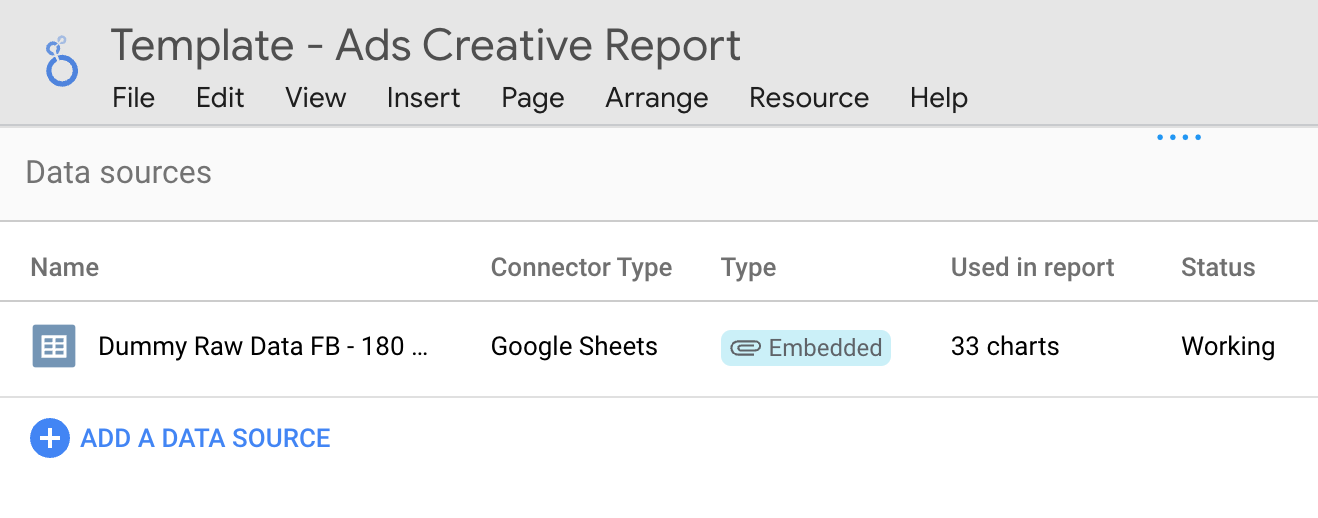
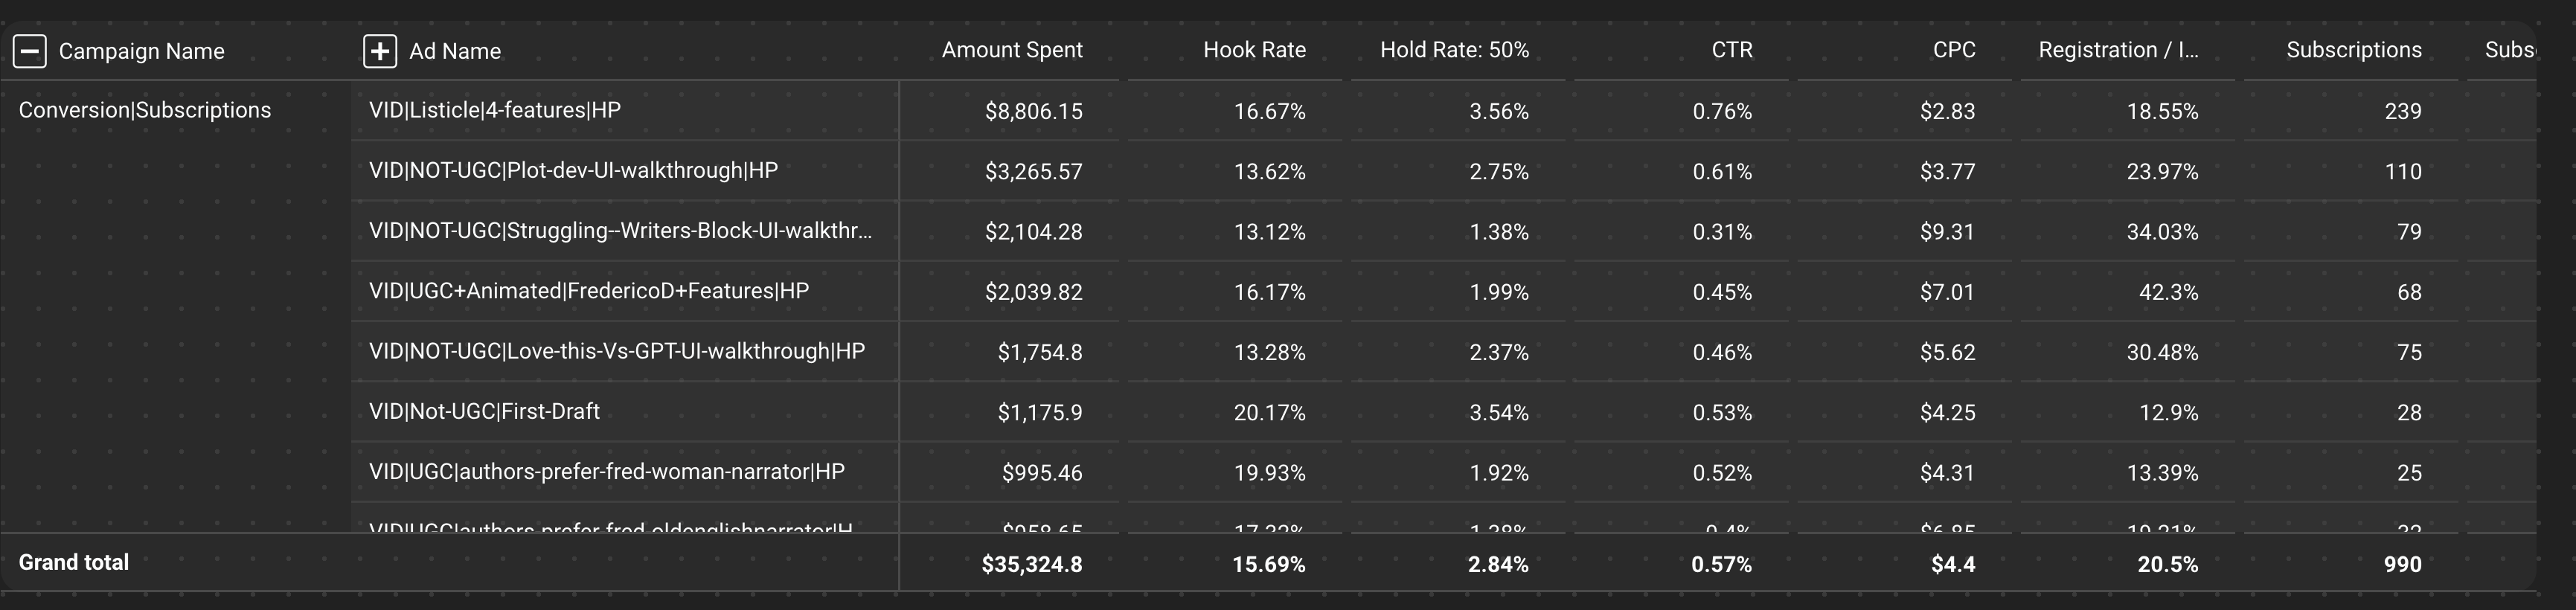
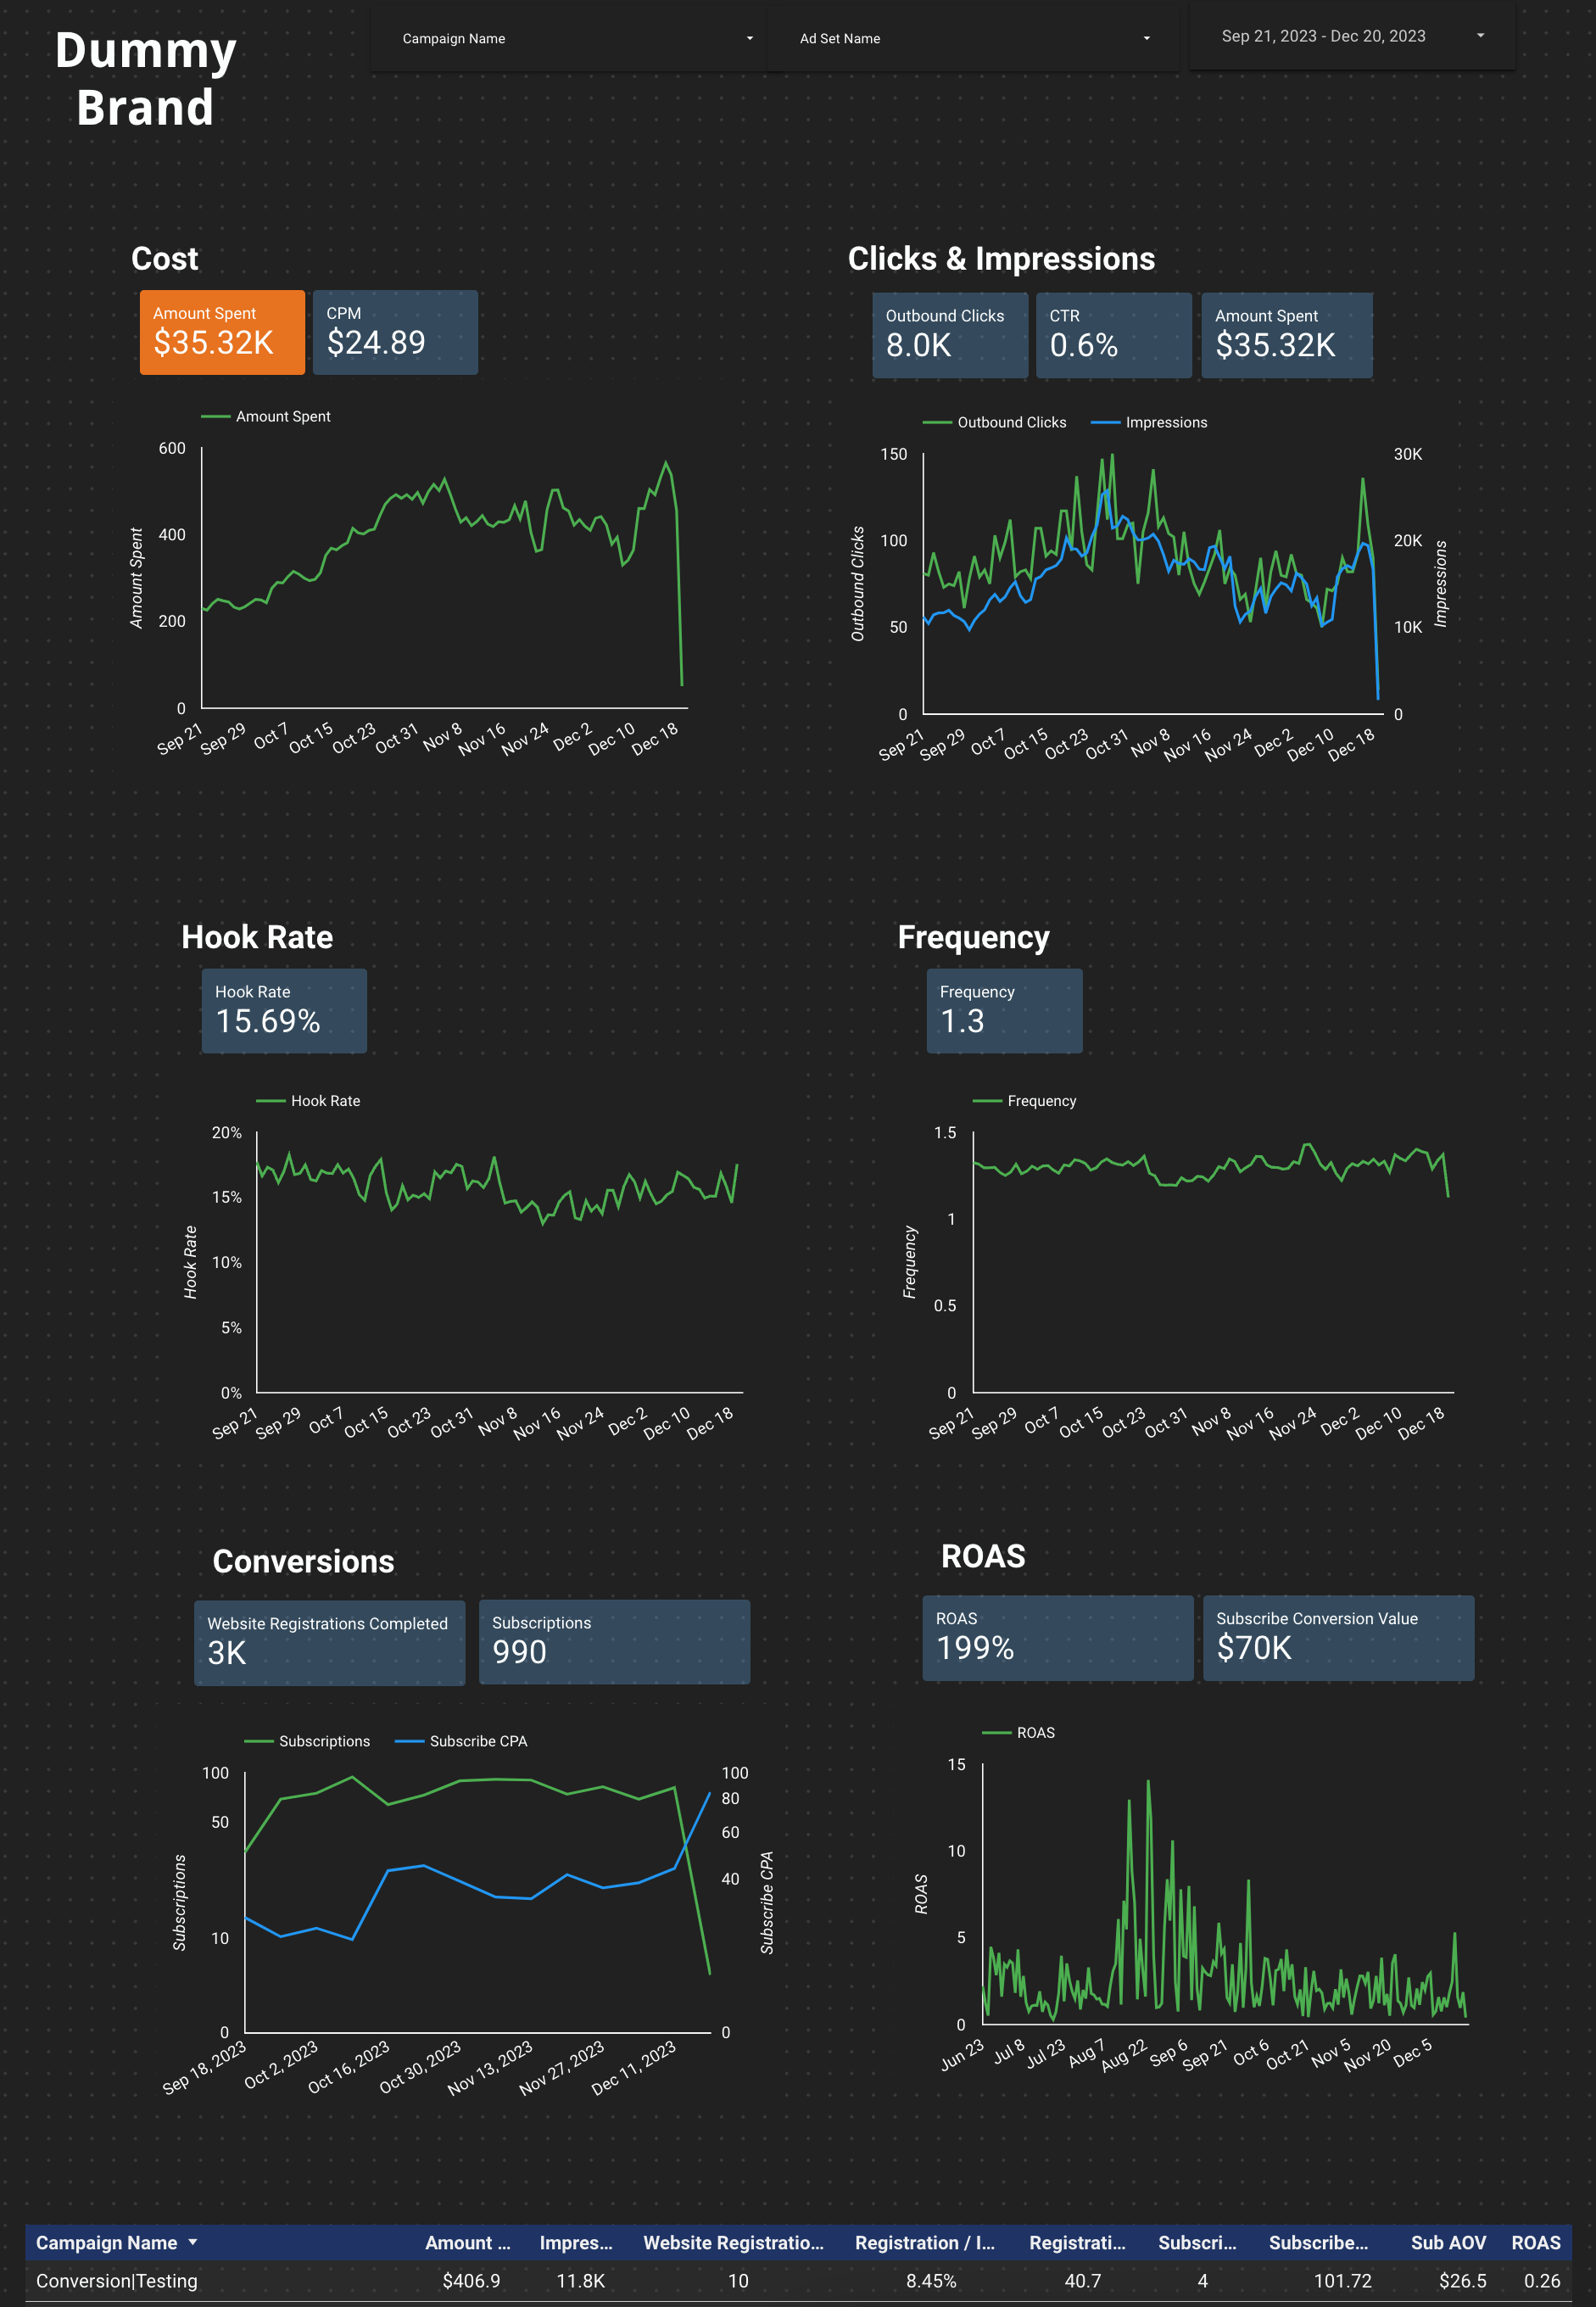
- Create Dashboard in Google Data Studio: Connect the Google Sheets data to Google Data Studio. Design the dashboard to display key metrics and enable interactive analysis.
- Analyze and Iterate: Use the dashboard to identify high-performing ads and inform future ad creative strategies.
- Maintain: Regularly update the data and dashboard to ensure ongoing relevance and accuracy.
This approach replicates some of the capabilities of apps like Motionapp, focusing on data-driven insights but to do this with Motionapp, it’ll run you $350/mo and it’s got usage caps.

Not to mention, you can build more than just creative dashboards - but also tables for other metrics you care about, like spend, clicks, conversions, ROAS by campaign or ad set if you use Google Data Studio.
Now, your data is only as good as you make it - so ensure you’re using a logical naming convention for your ad names so you can quickly understand what each ad is constructed with.
Dimensions worth calling out in the ad name string:
- Content style: UGC, lifestyle, editorial, animation, etc
- Format: video, static, carousel, GIF, etc
- Aspect ratio: 1:1, 4:5, 9:16, etc
- Length: 15, 30, 60 seconds
- Specific content: opening hook, creator name, etc
It’s a good idea to test along these dimensions. Format, style, length, and more have their unique strengths and weaknesses.
Using a brief building tool to communicate these dimension specifics to your creative team will not only drive the naming convention but also ensure these dimensions are front of mind with each iteration.
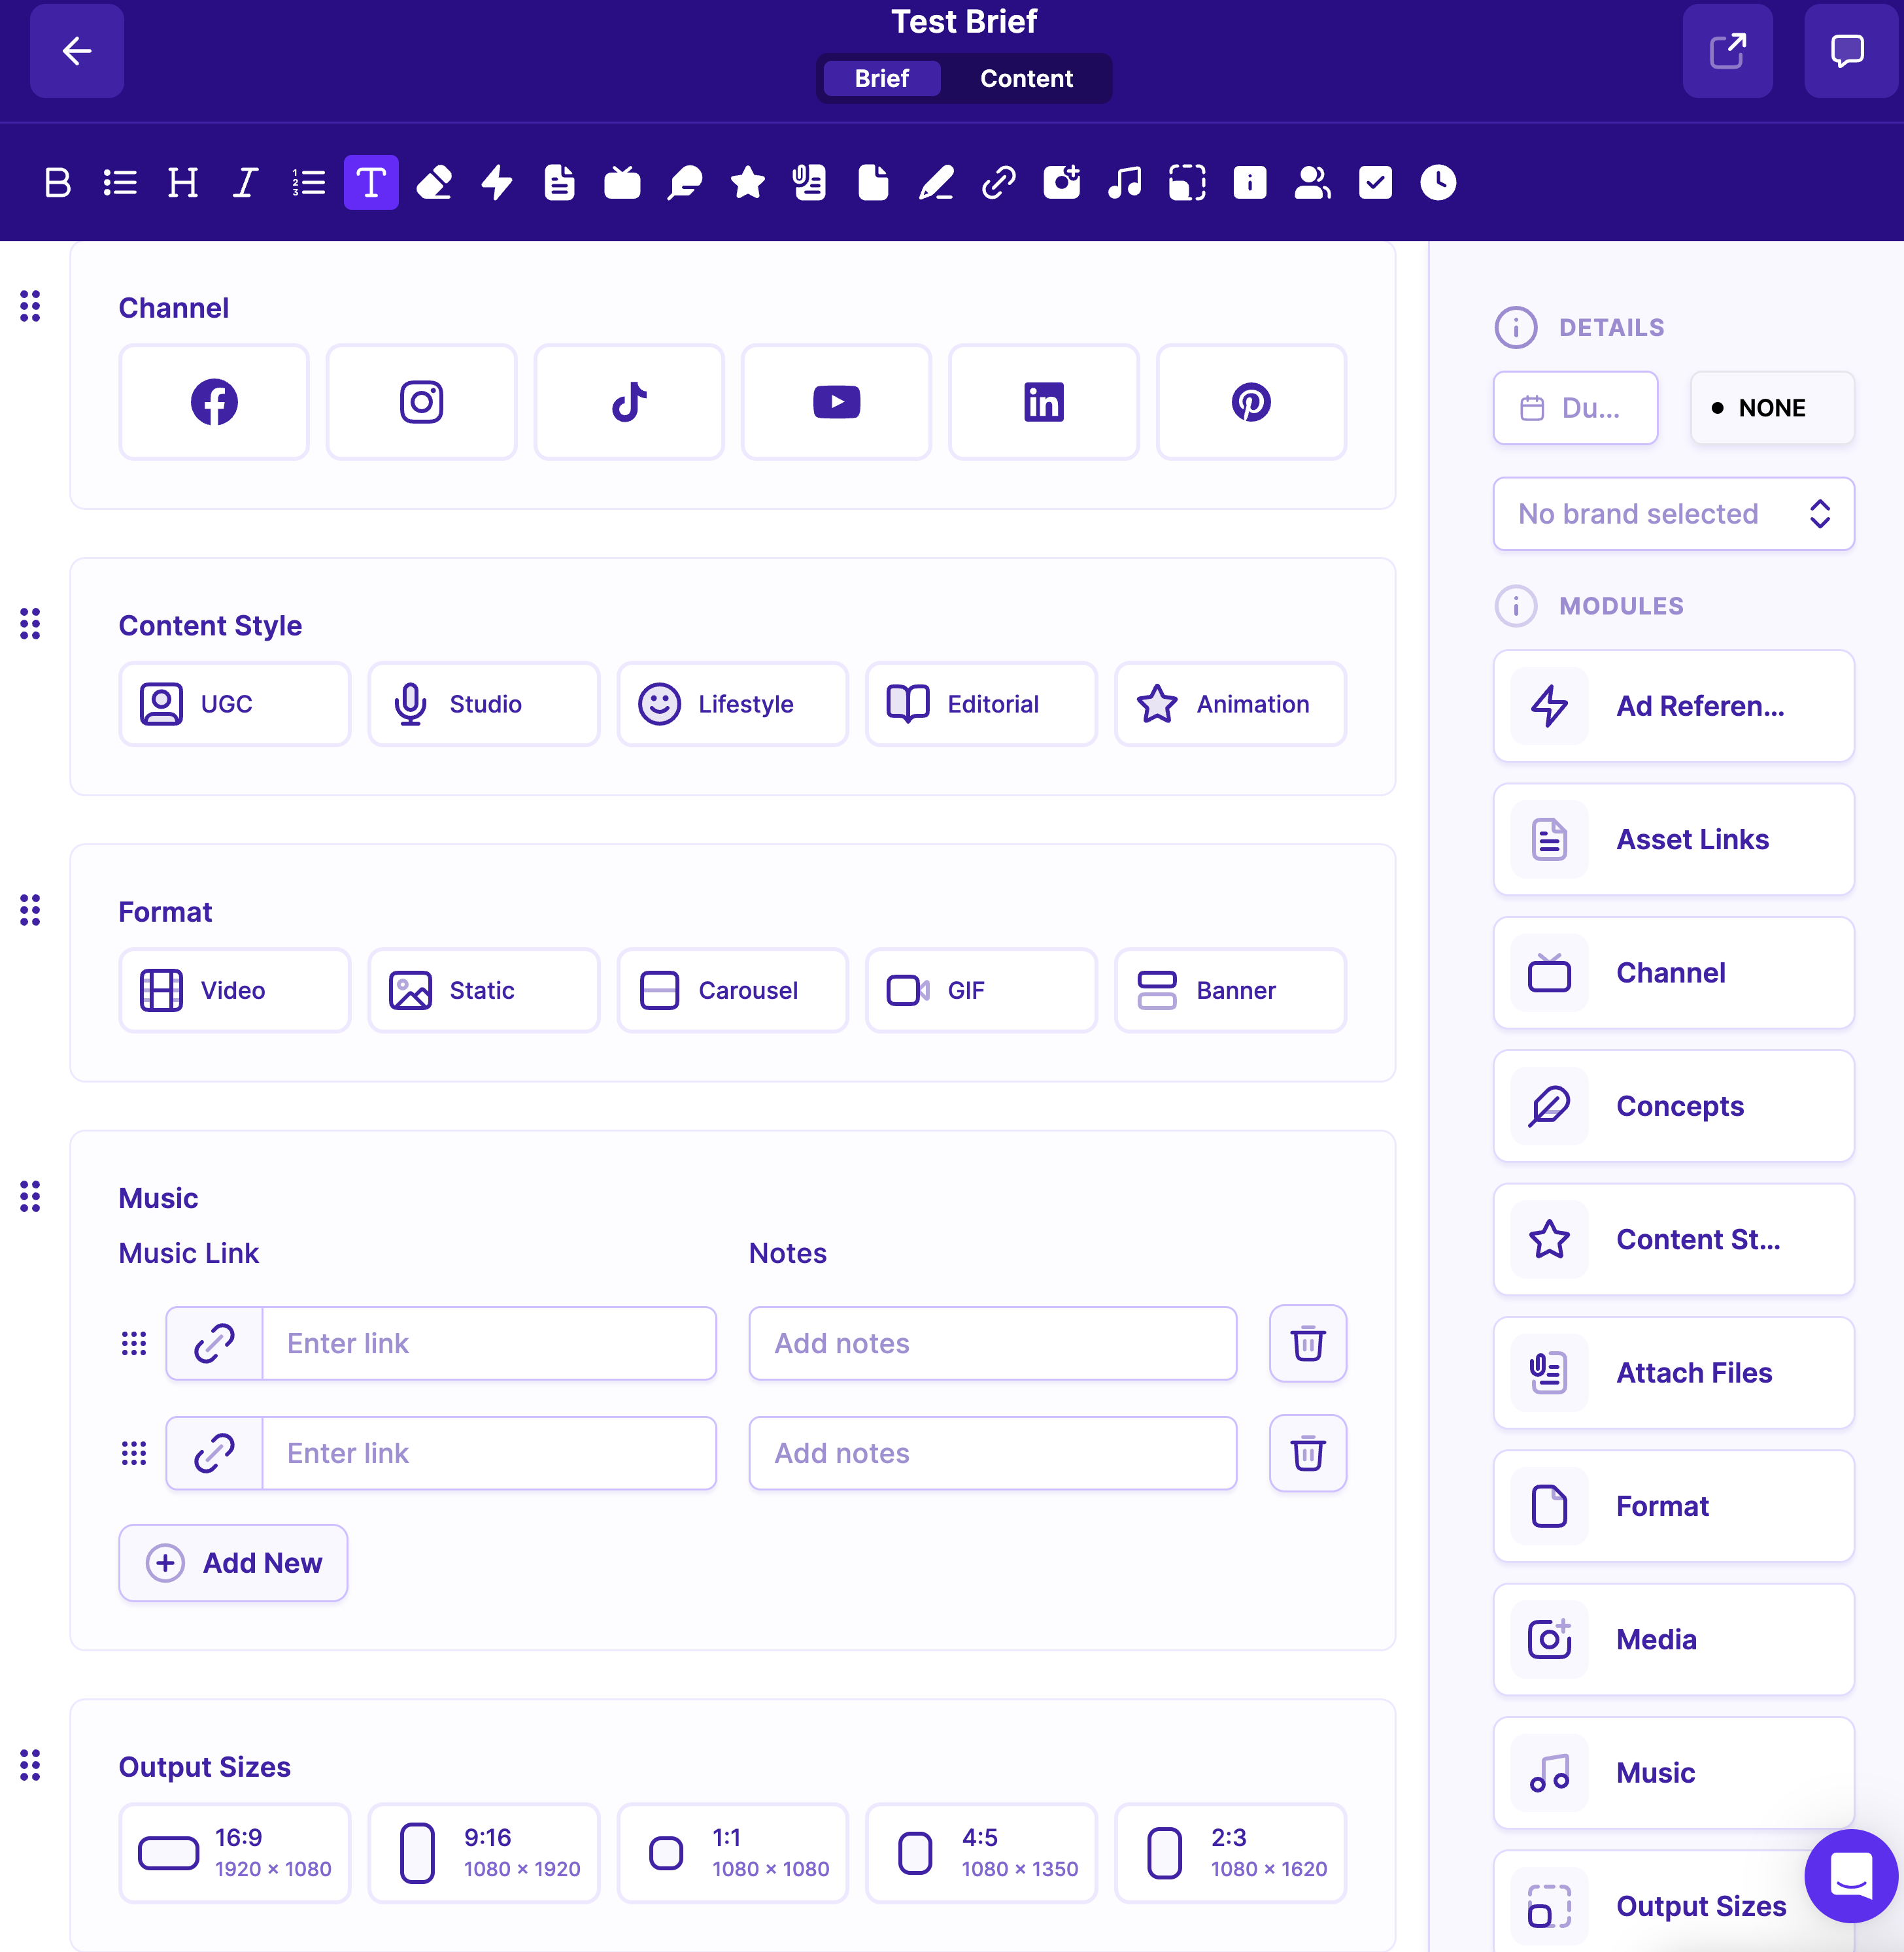
Here’s an example of Magicbrief’s brief building tool - which lays out many of these dimensions.
Enjoy! Let me know if you have questions and feel free to share with folks who might benefit.


.jpeg)